myViewBoard Knowledge Base


myViewBoard Manager


IT management of ViewSonic devices with a simple dashboard

myViewBoard Manager

IT management of ViewSonic devices with a simple dashboard

Reports

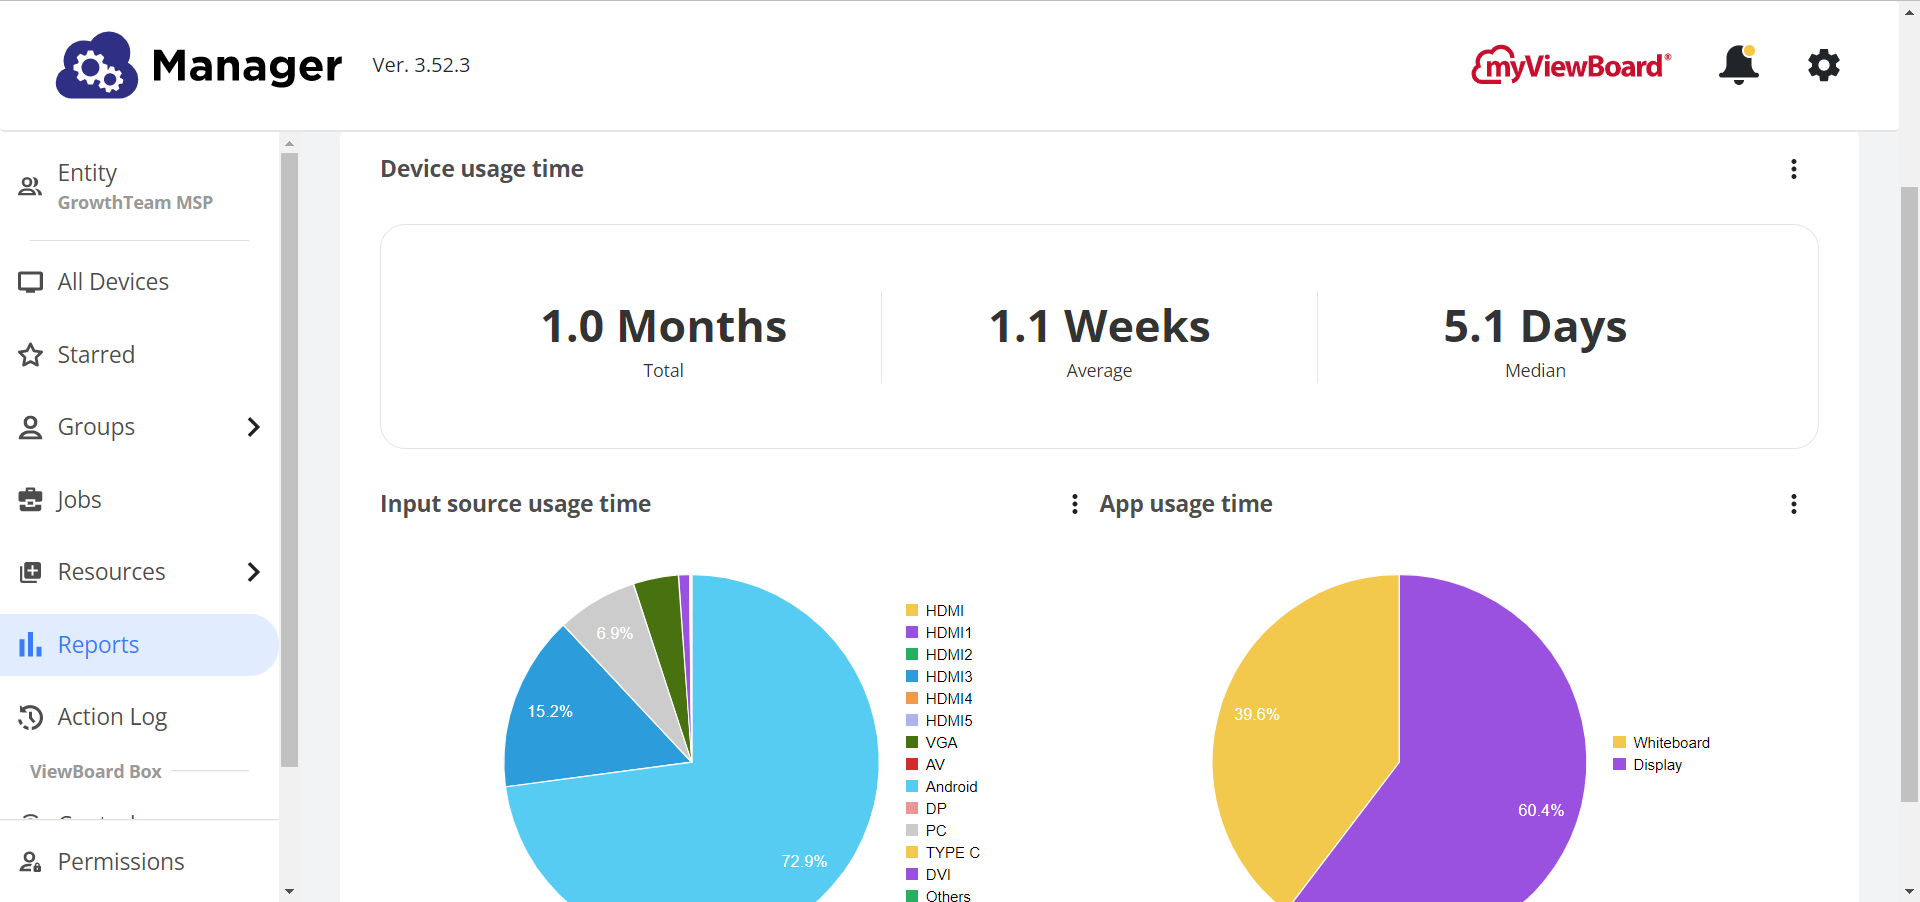
Device usage reports can be generated for custom time frames, displaying information about device, app, and input source usage times. These statistics are displayed graphically within the Reports panel or can be exported to an .xlsx file.

Access device usage reports by clicking Reports in the left-side menu of the Manager console.

Example of a usage report within Reports, with usage measured in time across input sources and apps.

Create a report

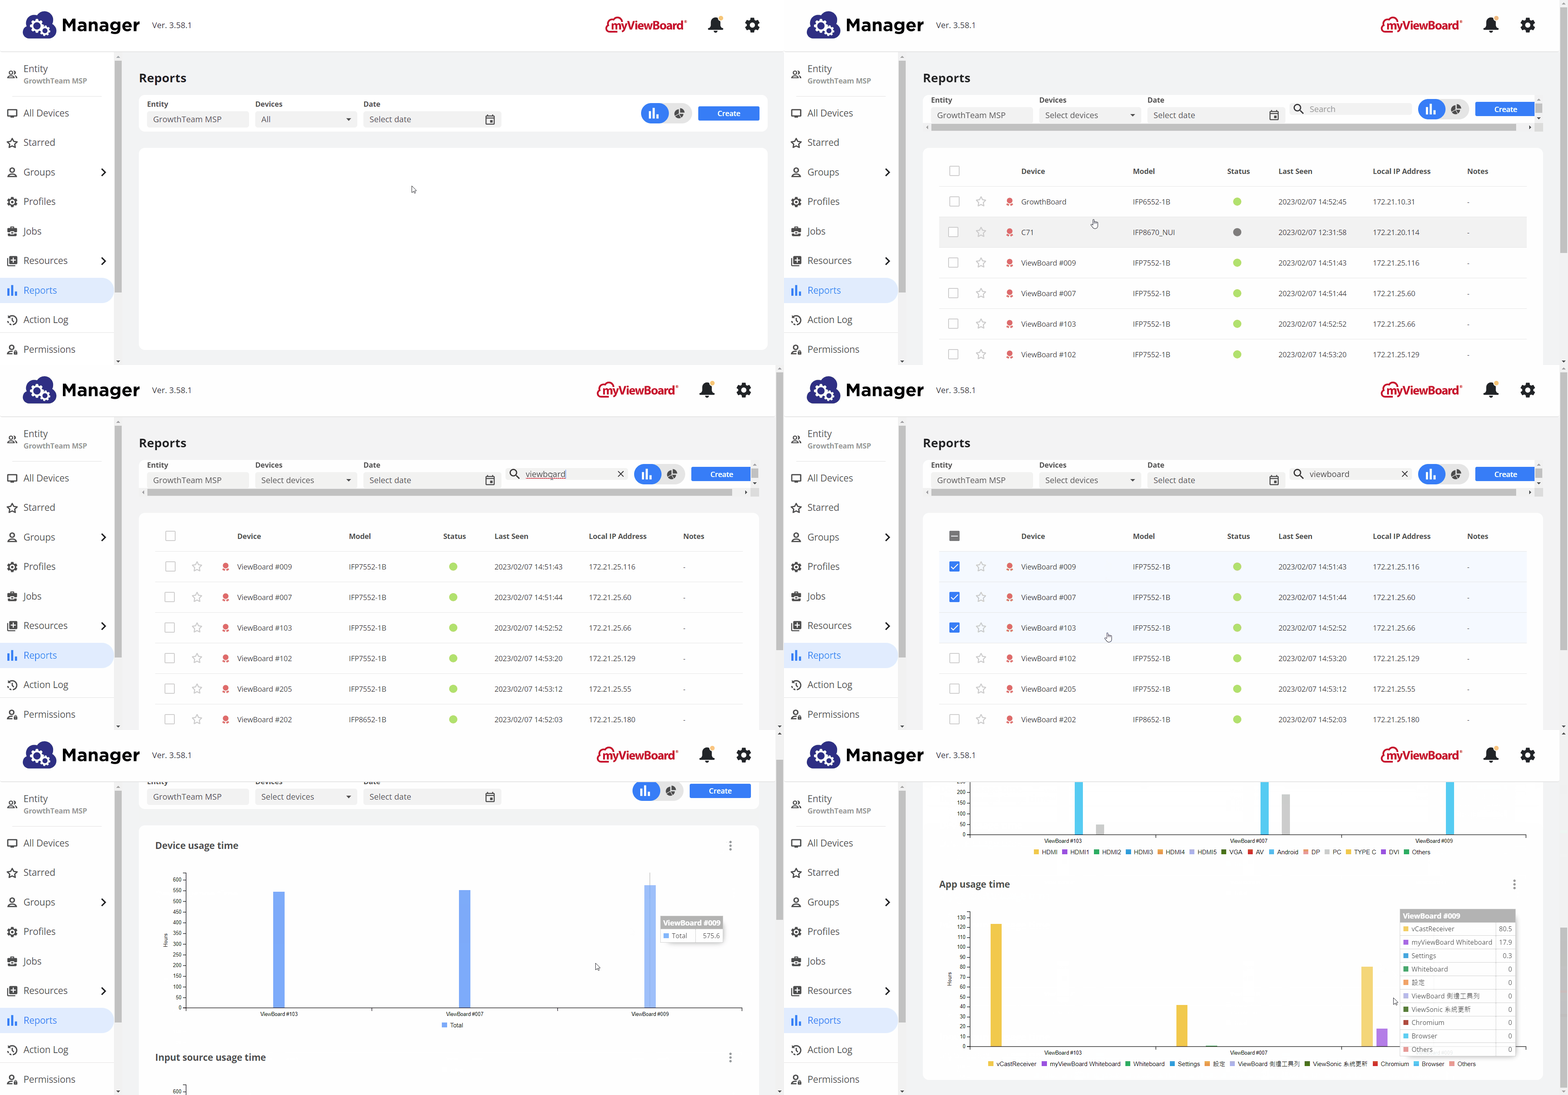
In the Reports page, create personalized reports by filtering for all devices, groups, and selected devices. 

  1. Press  Reports in the left-side menu.
  2. In the main toolbar, press the Devices drop-down menu to select between all devices, starred devices, groups, or select devices.
  3. Set a Date range (if necessary).
    • (Optional) In the search bar, filter for specific devices or groups of devices.
  4. Select between generating a bar  or pie graph  report.
  5. Press Create to generate a report.

User chooses to Select devices from the Devices drop-down and then filters for a device name. Then they create and browse a report. (Note: The search bar will also appear if the user chooses Groups.)

Export a report

After you have generated your desired report, the option to export an .xlsx file reflecting the data presented within Reports is available. Simply open the view options menu by pressing  and then Export to Excel file.

User has generated a report after filtering for their desired entity, devices, and date range. They have then opened the Device usage time view's menu to export the usage Excel file.

myViewBoard Knowledge Base

Need additional help?

Check our other resources — we'll be happy to assist you.